
|
The short answer. You do not need a thermal engineer or a modeling license to find the money in your steam system. You need four numbers — operating pressure, pipe diameter, linear feet of bare surface, and annual operating hours — plus your actual fuel cost and boiler efficiency. Published U.S. Department of Energy tables convert those into annual dollars in about ten minutes. In most plants the answer lands in the tens of thousands per year, and the biggest single surprise is almost always the valves and flanges nobody ever re-insulated after the last outage. |
Bare steam piping is the rarest thing in industrial energy management: a loss that runs every hour of every day, costs real money, requires no capital project to fix, creates no downtime to address, and can be quantified from a clipboard walk and a published table.
It also hides in plain sight. Insulation gets cut away for a repair and never goes back. A valve gets replaced and the cover disappears. A line gets added during an expansion and the insulation scope gets value-engineered out. None of it triggers an alarm, so none of it gets a work order. It just quietly burns fuel.
Here is how to put a number on it.
What do you actually need to calculate steam heat loss?
Heat loss from a bare pipe is driven by the temperature difference between the surface and the surrounding air, the amount of surface area exposed, and how long it stays hot. In practice, a facility manager needs six inputs — and four of them come straight off a walkthrough.
|
Input |
Where to get it |
Why it matters |
|---|---|---|
|
Steam pressure (psig) |
Line gauge, P&ID, or header schedule |
Sets saturation temperature, which drives the temperature difference |
|
Pipe diameter (NPS) |
Line list, pipe marking, or a tape measure |
Sets exposed surface area per foot |
|
Linear feet of bare pipe |
Physical walkdown, by diameter and pressure |
Direct multiplier on total loss |
|
Count of bare valves, flanges, and fittings |
Same walkdown, tallied by size and temperature |
Usually the most underestimated line item |
|
Annual operating hours |
Production schedule — actual, not nameplate |
A line hot 8,760 hours costs twice as much as one hot 4,380 hours |
|
Fuel cost ($/MMBtu) and boiler efficiency |
Utility bill and last combustion tune-up report |
Converts Btu into dollars — see the next two sections |
|
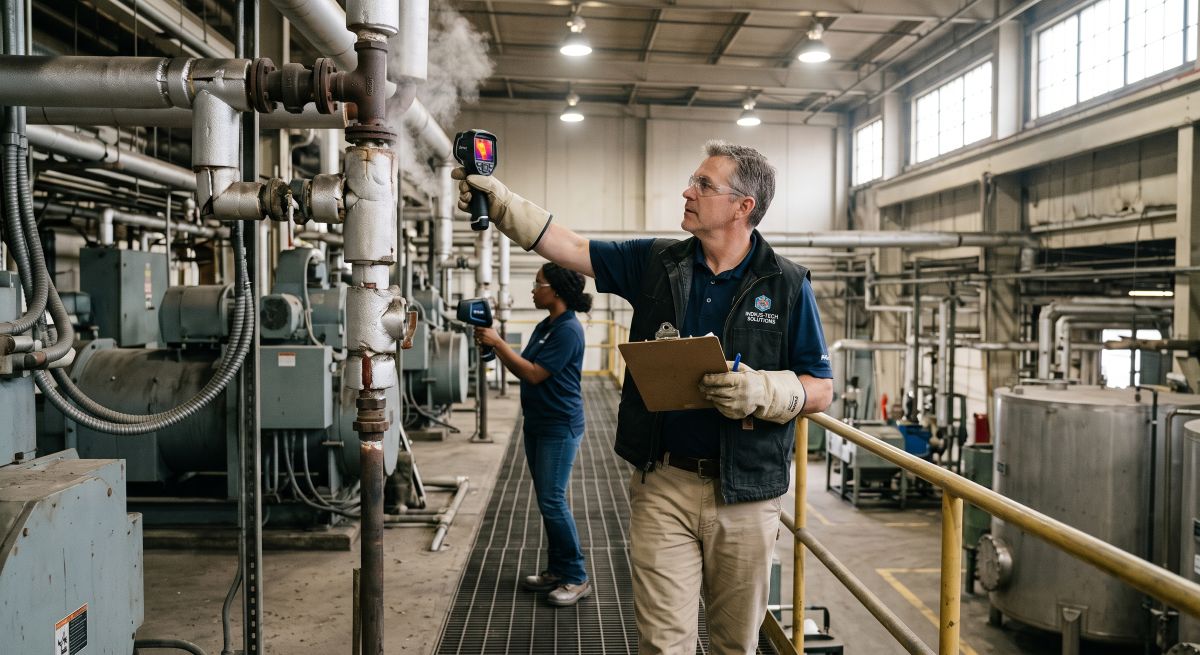
Do the walkdown with a camera and a notepad, in that order. Photograph every bare run and every naked valve with something in frame for scale. The tally is what produces the number; the photographs are what get the number funded. A spreadsheet line reading "180 ft of bare 4-inch at 150 psig" is an abstraction to a CFO. A photo of a glowing bare header above a walkway is not. |
Step 1: Find your real fuel cost in dollars per MMBtu
This is the step most in-house calculations get wrong, and it skews everything downstream. The number you want is your fully delivered cost of fuel — total gas spend divided by total energy purchased — not the commodity rate on the supplier contract. Demand charges, delivery charges, and taxes are all real dollars burned by a bare pipe.
Converting your bill to $/MMBtu
|
If your bill reads… |
Conversion |
Example |
|---|---|---|
|
Therms |
1 therm = 0.1 MMBtu, so $/MMBtu = $/therm × 10 |
$0.85/therm → $8.50/MMBtu |
|
Mcf (thousand cubic feet) |
1 Mcf ≈ 1.037 MMBtu, so $/MMBtu ≈ $/Mcf ÷ 1.037 |
$8.30/Mcf → $8.00/MMBtu |
|
CCF (hundred cubic feet) |
1 CCF ≈ 1 therm ≈ 0.1 MMBtu (varies with heat content) |
$0.85/CCF → roughly $8.50/MMBtu |
|
#2 fuel oil (gallons) |
1 gallon ≈ 0.139 MMBtu |
$3.20/gal → roughly $23/MMBtu |
The clean method: take twelve months of gas bills, add every charge, and divide by total MMBtu delivered over the same period. That single blended figure is what belongs in the calculation.
The examples throughout this guide use $8.00/MMBtu, the working figure in the DOE steam tip sheets. Delivered industrial gas prices vary widely by state and by contract, so substitute your own number — the arithmetic scales linearly, and doubling the fuel cost doubles every dollar figure below.
Step 2: Understand why boiler efficiency multiplies the loss
A bare pipe does not waste steam. It wastes fuel — and it takes more than a Btu of fuel to deliver a Btu of steam. If your boiler runs at 80% efficiency, every 1 MMBtu radiating off a bare line requires 1.25 MMBtu of gas at the burner.
Fuel input wasted = Heat lost from the surface ÷ Boiler efficiency
Skipping this division understates the loss by 20–30%. Pull the efficiency figure from your most recent combustion tune-up report. A well-maintained natural gas firetube boiler typically runs in the high 70s to mid 80s; if you have no report at hand, 80% is a defensible working assumption — and the absence of a recent report is its own finding.
Step 3: Calculate heat loss from bare pipe
The Department of Energy publishes the table that does most of this work. It gives annual heat loss per 100 feet of uninsulated steam line, by diameter and pressure, for horizontal steel pipe in 75°F still air running 8,760 hours a year.
Heat loss per 100 feet of uninsulated steam line (MMBtu/yr)
|
Line diameter |
15 psig |
150 psig |
300 psig |
600 psig |
|---|---|---|---|---|
|
1 in. |
140 |
285 |
375 |
495 |
|
2 in. |
235 |
480 |
630 |
840 |
|
4 in. |
415 |
850 |
1,120 |
1,500 |
|
8 in. |
740 |
1,540 |
2,030 |
2,725 |
|
12 in. |
1,055 |
2,200 |
2,910 |
3,920 |
Source: U.S. Department of Energy, Steam Tip Sheet #2. Based on horizontal steel pipe, 75°F ambient air, no wind velocity, 8,760 operating hours per year.
The method is straightforward: multiply the table value by your footage in hundreds of feet, for each combination of diameter and pressure.
Annual heat loss (MMBtu/yr) = (Linear feet ÷ 100) × Table value
Two adjustments if your conditions differ from the table basis. If a line runs fewer than 8,760 hours a year, scale the result by your actual hours divided by 8,760. If a line runs outdoors, expect losses above the table value — wind strips heat off a bare surface far faster than still air, and the table assumes none.
Step 4: Convert the loss into annual dollars
Insulation does not eliminate loss; it reduces it. DOE reports that insulating a bare line typically cuts energy losses by about 90%, and that recovery factor belongs in the calculation.
Annual savings ($) = ( 0.90 × Heat loss MMBtu/yr × $/MMBtu ) ÷ Boiler efficiency
What one foot of bare pipe costs you per year
Running the DOE table through that formula at $8.00/MMBtu and 80% boiler efficiency produces the number most facility managers find genuinely motivating — the annual recoverable cost of a single bare foot of pipe.
|
Line diameter |
15 psig |
150 psig |
300 psig |
600 psig |
|---|---|---|---|---|
|
1 in. |
$13 |
$26 |
$34 |
$45 |
|
2 in. |
$21 |
$43 |
$57 |
$76 |
|
4 in. |
$37 |
$77 |
$101 |
$135 |
|
8 in. |
$67 |
$139 |
$183 |
$245 |
|
12 in. |
$95 |
$198 |
$262 |
$353 |
Derived from DOE Steam Tip Sheet #2 heat loss values. Assumes 90% loss recovery, 80% boiler efficiency, $8.00/MMBtu fuel, 8,760 operating hours. Scale linearly for a different fuel cost.
|
Read that table as a permission slip. A 40-foot bare run of 8-inch header at 150 psig is roughly $5,500 a year. That is not an energy conservation initiative requiring a steering committee — it is a maintenance backlog item with a return most capital projects cannot match. Small numbers per foot become large numbers per plant because bare footage is almost never concentrated in one place. |
Step 5: Count the valves — this is where the surprise lives
Straight pipe gets insulated because it is easy to insulate. Valves, flanges, strainers, expansion joints, and steam traps get stripped for maintenance and stay bare, because putting rigid insulation back over a component that will be opened again is a losing proposition. So they accumulate.
DOE publishes savings figures for installing removable insulated covers, calculated per ASTM C680:
Energy savings from installing removable insulated valve covers (Btu/hr)
|
Operating temp. |
3 in. |
4 in. |
6 in. |
8 in. |
10 in. |
12 in. |
|---|---|---|---|---|---|---|
|
200°F |
800 |
1,090 |
1,560 |
2,200 |
2,900 |
3,300 |
|
300°F |
1,710 |
2,300 |
3,300 |
4,800 |
6,200 |
7,200 |
|
400°F |
2,900 |
3,400 |
5,800 |
8,300 |
10,800 |
12,500 |
|
500°F |
4,500 |
6,200 |
9,000 |
13,000 |
16,900 |
19,700 |
|
600°F |
6,700 |
9,100 |
13,300 |
19,200 |
25,200 |
29,300 |
Source: U.S. Department of Energy, Steam Tip Sheet #17. Based on a 1-inch thick insulating pad on an ANSI 150-pound-class flanged valve.
|
Watch the units — the two DOE tables do not report the same thing. Tip Sheet #2 gives gross heat loss from bare pipe in MMBtu per year, so you apply the 90% recovery factor to it. Tip Sheet #17 gives savings already achieved by installing a cover, in Btu per hour, so no recovery factor applies — but you must multiply by operating hours and divide by 1,000,000 to reach MMBtu. Mixing the two conventions is the most common arithmetic error in a self-performed survey, and it runs in both directions. |
One 6-inch gate valve at 400°F is 5,800 Btu/hr. Over 8,760 hours that is roughly 51 MMBtu a year, or about $510 at $8.00/MMBtu and 80% efficiency. A plant with forty bare valves of assorted sizes is carrying a five-figure annual loss in components that take an afternoon to measure and no downtime to cover.
A worked plant survey, start to finish
A walkdown of a mid-size manufacturing plant on a 150 psig header, running continuously, turns up the following.
|
Finding |
Calculation |
Annual heat loss |
|---|---|---|
|
400 ft bare 2 in., 150 psig |
4.00 × 480 MMBtu |
1,920 MMBtu/yr |
|
180 ft bare 4 in., 150 psig |
1.80 × 850 MMBtu |
1,530 MMBtu/yr |
|
260 ft bare 1 in. condensate return, 15 psig |
2.60 × 140 MMBtu |
364 MMBtu/yr |
|
Bare pipe subtotal (gross loss) |
3,814 MMBtu/yr |
|
|
Recoverable at 90% insulation efficiency |
3,814 × 0.90 |
3,433 MMBtu/yr |
|
20 bare 4 in. valves at ~400°F |
20 × 3,400 Btu/hr × 8,760 hr |
596 MMBtu/yr |
|
14 bare 6 in. valves at ~400°F |
14 × 5,800 Btu/hr × 8,760 hr |
711 MMBtu/yr |
|
Valve subtotal (already net savings) |
1,307 MMBtu/yr |
|
|
Total recoverable heat |
3,433 + 1,307 |
4,740 MMBtu/yr |
Converting to fuel and dollars at 80% boiler efficiency and $8.00/MMBtu:
Fuel input saved = 4,740 ÷ 0.80 = 5,925 MMBtu/yr
Annual savings = 5,925 × $8.00 = $47,400 per year
|
Where the leverage actually sits. The 34 valves account for 28% of the total recoverable energy — from components representing a rounding error in surface area next to 840 feet of pipe. They are also the cheapest scope to execute: no scaffolding along a header run, no fabrication to length, no shutdown, and the covers come off again the next time the valve needs service. If the budget only covers one phase, do the valves first. Highest recovery per labor hour, fastest to install, and the covers are reusable assets rather than a one-time consumable. |
Turning that into a payback number
Payback is a single division once you have a quote in hand:
Simple payback (years) = Installed cost ÷ Annual savings
Against $47,400 a year, a $25,000 installed scope pays back in roughly 6 months, a $50,000 scope in about 13 months, and a $75,000 scope in about 19 months. Insulation carries no moving parts and no maintenance schedule, so after payback the savings continue for the service life of the installation.
Ranking the low-hanging fruit
Not all bare surfaces are equally worth chasing. Prioritize in this order.
- Bare valves, flanges, and fittings on hot service. Highest dollars per labor hour, no downtime, reusable covers, and the scope is bounded by a countable component list rather than by footage.
- Large-diameter, high-pressure bare pipe. A bare foot of 8-inch at 300 psig costs about seven times a bare foot of 1-inch at 15 psig. Go where the table values are largest.
- Wet or water-damaged insulation. Saturated insulation can lose most of its thermal value while still looking installed. It also drives corrosion under insulation on the pipe underneath, which turns an energy problem into an asset integrity problem.
- Continuously operating lines before seasonal ones. A line hot 8,760 hours a year returns twice what an identical line hot 4,380 hours returns. Same scope, double the payback.
- Condensate return lines. Frequently skipped on the theory that they are "only" 220°F, but they are typically long, numerous, and run continuously. The footage adds up faster than the temperature suggests.
- Personnel-contact surfaces. Any hot surface within reach of a walkway is a burn exposure as well as an energy loss. This scope often gets funded out of a safety budget rather than an energy budget — which makes it easier to approve.
Six ways the calculation goes wrong
- Omitting boiler efficiency. Understates the loss by 20–30% every time. The pipe wastes fuel, not steam.
- Using nameplate hours instead of actual hours. A header that blocks in over weekends and holidays is not running 8,760 hours. Overstating hours produces a number that will not survive scrutiny — and credibility matters more than magnitude when the request goes up the chain.
- Counting pipe and skipping fittings. In the worked example above, ignoring the valves would have understated the opportunity by more than a quarter.
- Assuming insulation that exists is insulation that works. Crushed, gapped, saturated, or missing-jacket insulation performs nowhere near its rated value. Survey condition, not presence.
- Using the commodity gas rate instead of the delivered cost. Delivery, demand, and tax charges are all burned by a bare pipe too.
- Ignoring wind on outdoor lines. The DOE table assumes still air. Outdoor runs lose more, sometimes considerably more, which means outdoor bare pipe is under-credited in a table-based survey rather than over-credited.
Matching insulation to the application
Once the survey identifies the scope, product selection follows service temperature, geometry, and whether the component needs to be opened again.
|
Application |
Typical solution |
Why |
|---|---|---|
|
Straight-run steam and condensate piping to 850°F |
Fiberglass pipe insulation |
Lightweight, economical, widely available in ASTM C585 sizes; well suited to elevated and hung runs |
|
High-temperature or high-compressive-load piping |
Mineral wool or calcium silicate |
Higher service temperature and denser structure where fiberglass is out of range |
|
Valves, flanges, strainers, traps, expansion joints, pumps |
Custom removable insulation blankets |
Come off in seconds for service and go back on just as fast — no cutting, no re-fabrication, no lost insulation after the next outage |
|
Elbows, tees, 45s, reducers |
Pre-formed insulation shapes and fitting covers |
Fitted geometry eliminates the gaps and thermal bridges that hand-cut segments leave behind |
|
Large ductwork, breeching, exhaust, tanks and vessels |
Industrial insulation wraps and tank insulation |
Covers large or irregular area efficiently where rigid sectional product does not apply |
Product detail: Thermal Pipe Insulation · Fiberglass Pipe Insulation · Removable Insulation Blankets · Industrial Insulation Wraps
|
Two things to confirm before you specify. First, insulate to the correct thickness for the service temperature rather than to whatever is on the shelf — under-thickness leaves recoverable energy on the table, and over-thickness stops paying for itself. Second, on any line where moisture can reach the pipe, treat the jacketing and vapor detail as part of the thermal scope: wet insulation both stops working and accelerates corrosion under insulation on the substrate beneath it. |
Frequently asked questions
How do I calculate heat loss from a bare steam pipe?
Identify the pipe diameter and steam pressure, then look up the annual heat loss per 100 feet in the DOE Steam Tip Sheet #2 table. Multiply that value by your linear footage divided by 100. Scale the result if the line runs fewer than 8,760 hours a year. The output is gross annual heat loss in MMBtu.
How much does one foot of bare steam pipe cost per year?
At $8.00/MMBtu fuel, 80% boiler efficiency, and continuous operation, a single bare foot ranges from roughly $13 a year for 1-inch line at 15 psig to roughly $353 a year for 12-inch line at 600 psig. A bare foot of 4-inch at 150 psig runs about $77 a year.
Does insulation really reduce heat loss by 90%?
DOE reports that insulation typically reduces energy losses from bare steam distribution and condensate return lines by about 90%. Actual performance depends on insulation type, thickness, condition, and installation quality — gaps, compression, and moisture all reduce it.
Why do I have to divide by boiler efficiency?
Because a bare pipe wastes fuel, not steam. Producing 1 MMBtu of steam in an 80% efficient boiler consumes 1.25 MMBtu of fuel, so the fuel cost of a surface loss is the heat lost divided by boiler efficiency. Omitting this step understates the loss by 20 to 30%.
How do I find my plant's fuel cost in dollars per MMBtu?
Take twelve months of fuel bills, add every charge including delivery, demand, and taxes, and divide by total MMBtu delivered. If billed in therms, multiply the per-therm rate by 10. If billed in Mcf, divide the per-Mcf rate by about 1.037. Use the blended delivered cost, not the commodity rate.
Are uninsulated valves and flanges worth insulating?
Usually they are the best return in the building. A bare 6-inch valve at 400°F loses about 5,800 Btu/hr, roughly $510 a year at $8.00/MMBtu and 80% efficiency. Removable covers install without downtime and come back off for maintenance, so the insulation is not lost at the next outage.
What surface temperature should be insulated?
DOE guidance is that any surface over 120°F should be insulated, including boiler surfaces, steam and condensate return piping, and fittings. Surfaces reachable from a walkway also warrant insulation as a contact-burn control, independent of the energy case.
What is a typical payback period for steam line insulation?
Simple payback equals installed cost divided by annual savings. Because bare-line losses run continuously and insulation has no operating cost, paybacks are commonly measured in months rather than years — a scope saving $47,400 a year pays back a $25,000 installation in roughly six months.
|
Bring us the walkdown. We will help you turn it into a scope. The Insulation Guy has supplied industrial insulation nationwide since 1989 — fiberglass, mineral wool, calcium silicate, custom removable blankets, fitting covers, wraps, and tank insulation. Send your survey tally: footage and diameter by pressure, plus a count of bare valves and fittings by size and service temperature. We will help you match material to service, size the thickness, and put a real number against the payback you calculated. |